
30+ Pert Chart Templates – DOC, PDF
PERT chart template is like a guidebook for project management. This work visualization design helps project managers see the big picture of their projects. It lets you figure out where each piece of your project goes, what order they should go in, and how long each will take to fit into place.
The U.S. Navy first made these project planning templates in the 1950s to help build submarines. Today, they are used everywhere. They show you the start and finish line of your project and all the steps between, like checkpoints in a race. This helps everyone stay on track and finish the project on time.
- Accounting Templates
- Art & Media
- Budget Templates
- Business Templates
- Calendar Templates
- Certificates
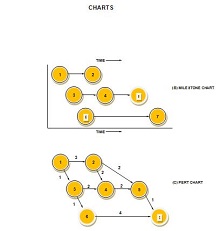
- Charts
- Education Templates
- Inventory Templates
- Invoice Templates
- Letter Templates
- Medical Templates
- Personal Templates
- Project Plan Templates
- Timesheet Templates
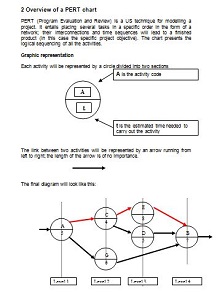
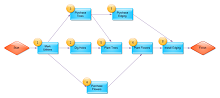
What is a PERT Chart?
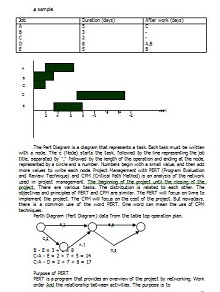
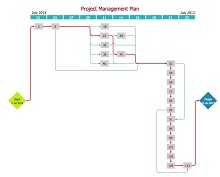
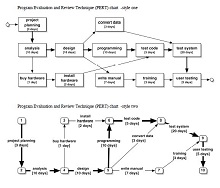
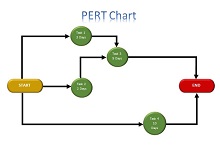
A PERT (Program Evaluation Review Technique) Chart is a graphical tool that helps project managers plan and organize tasks for big projects. These charts are super-helpful because they tell you the order to do tasks, how long each one should take, and which tasks are the most important to finish right on schedule.
Using a PERT chart can make it 80% more likely that you’ll finish your project on time! So, if you’re building something big like a robot or planning an event like a school play, a PERT diagram can be your best friend in staying organized and cool as a cucumber. When selecting a task scheduling template for your project management needs, it’s vital to identify a layout that offers functionality and accessibility.

5 key Features of PERT Chart Templates
When selecting a template for your project management needs, it’s vital to identify a layout that offers functionality and accessibility. Here are key features you should look for:
- User-Friendly: The ideal PERT chart should be easy to use, regardless of a person’s expertise in project management. 76% of employees prefer technology that requires little to no training; a user-friendly chart ensures widespread adoption and ease of use within a team.
- Customizable: Every project and your PERT chart should be unique, too. Look for those project planning templates that allow easy adjustments to meet your project’s specific needs and unique dependencies.
- Visualization: The power of a PERT diagram lies in its ability to visualize complex projects. It offers clear, detailed, and aesthetic graphical representations, making it easier for teams to grasp project scope and details at a glance.
- Progress Monitoring: Timelines shift, and tasks progress at varying speeds. A PERT chart that provides real-time progress monitoring helps keep track of the project’s evolution, leading to proactive rather than reactive management.
- Dependency Tracking: In a PERT diagram, understanding how tasks are linked is crucial. A task scheduling template that simplifies tracking these dependencies can prevent blocks and ensure a smoother flow of operations.
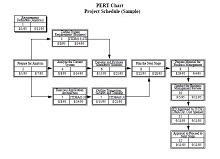
Key Components of a PERT Chart Template
Key elements of a PERT Design aid in project planning and in reinforcing the systematic execution of tasks:
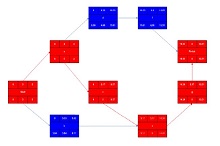
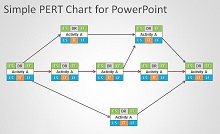
- Events: Identified as nodes on the chart, events signify the start and completion of tasks. They are critical in mapping the sequence of activities throughout a project.
- Activities: Represents the tasks; activities connect lines between events. Each activity has a duration that impacts the timeline.
- Dependencies are the relationships between tasks that determine the order of operations. Understanding dependencies is crucial to creating a realistic project schedule.
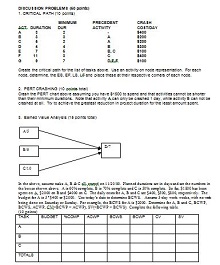
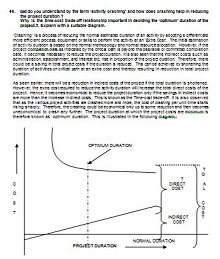
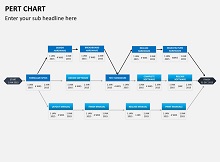
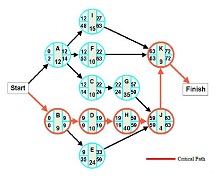
- Critical Path: The sequence of activities with the longest duration dictates the minimum time needed to complete the project. Mastery of the critical path is essential for efficient project management.
- Time Estimates: Provide a range for how long activities will take, including optimistic, pessimistic, and most likely durations. Accurate time estimates are the cornerstone of reliable project forecasting.
- Milestones: Key points within the project timeline that mark significant achievements or phases. Monitor milestones to keep the project on track.
How to Create a PERT Chart Template?
PERT charts can significantly enhance your project management capabilities. Creating your first PERT template involves the following steps:
Choose the Right Software or Template
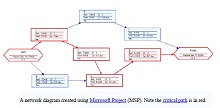
The market offers various PERT chart tools — ranging from sophisticated software that provides in-depth analytics to simple, user-friendly project management tool templates for new users. Microsoft Project is a popular choice, but there are free alternatives, like OpenOffice or Google Sheets, which offer sufficient functionalities for small to medium-sized projects. You can also use our editable templates of the PERT chart. These templates are easy to modify, and you can use them freely.
Map out Initial Tasks and Milestones
List all project activities and identify key milestones. This step is crucial; a Harvard Business Review study found that, on average, one in six IT projects faced a cost overrun of 200%, with schedule overruns of nearly 70%. Proper mapping from the start can help keep your project within scope.
Assign Time Estimates and Dependencies
Assign realistic timeframes to each task and note dependencies, such as when one task can’t start until another finishes. This builds a more actionable timeline. Keep in mind Parkinson’s Law, which states, “Work expands to fill the time available for its completion.” Set clear deadlines to maintain progress without wasting time.
How to use the PERT chart template?
To effectively utilize a workflow visualization template and streamline the project management process, follow these user-friendly steps:
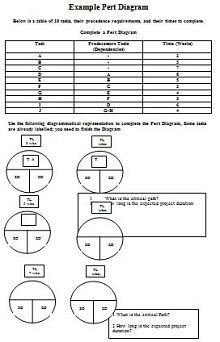
- Identify Project Tasks: Write down all the tasks that your project entails. Don’t worry about the order yet; make sure every activity required from the outset to the conclusion of your project is captured.
- List Task Dependencies: Determine which tasks must lead it and which ones follow. It is vital to understand these dependencies to ensure the project follows smoothly.
- Label Dependencies: Assign a clear and easily understandable label to each dependency. This will promote clarity when reviewing your chart to determine the next steps or inform team members of the task sequences.
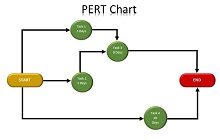
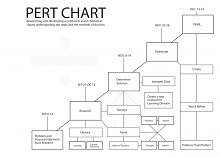
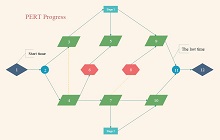
- Construct a Network Diagram: Using the information you have gathered, draw your network diagram by connecting all your events (nodes) with the corresponding activities (arrows). This visual representation is the heart of your Project management tool.
- Identify the Critical Path: Examine your network diagram to pinpoint the critical path, the longest chain of dependent activities. This will guide you on where to focus your efforts and resources to avoid delays and ensure project success.
- Share Your Diagram: Finally, share your newly created PERT chart with your team. Collaboration and transparency are key to the team’s collective efforts to keep the project on track.
How PERT Charts are Helpful for Different Industries?
PERT charts can be modified to suit the specific needs of distinct industries and project types. Here are some examples of how PERT charts can be utilized in various fields:
- Information technology (IT): In complex IT projects with many stages and dependencies, PERT charts can help visualize and manage the components involved.
- Construction: For large projects involving many teams, tasks, and resources, PERT charts can help coordinate activities and ensure the timely completion of milestones.
- Research and Development (R&D): In technical projects that emphasize experimentation and testing, PERT charts help plan the process and track progress.
- Marketing campaigns: A PERT diagram can be used to manage timelines, tasks, and dependencies for marketing campaigns with a specific launch date or deadline.
Pros and Cons of PERT Charts for Project Management
The pros and cons of the PERT charts for Project Management are:
Pros of PERT Charts for Project Management
The Pros of PERT Charts for Project Management:
- Facilitates Better Planning and Scheduling: PERT templates allow project managers to break down the whole project into individual tasks, which can be easier to manage and schedule.
- Enhances Understanding through Visualization: By visualizing tasks, dependencies, and timelines on a PERT chart, all projects can have a clearer understanding of the project’s flow.
- Increases Flexibility in Managing Projects: With a PERT chart, it becomes easier to identify which sequences of tasks can be rearranged or adjusted without impacting the final deadline.
- Highlights Critical Pathways: The critical path is an essential aspect of project management, as it outlines the sequence of tasks that can affect the project completion time. PERT schedules help to pinpoint these tasks. It enables managers to allocate resources efficiently and mitigate any possible associated risks.
- Improves Time Management: According to the Project Management Institute, only 64% of projects meet their goals. Project management charts assist in setting realistic timelines by accounting for uncertainty and providing estimates that reflect the best-case, worst-case, and most-likely scenarios.
- Facilitates Resource Optimization: Project managers can use PERT charts to optimize resource allocation. By analyzing the tasks and timelines, they can assign resources in a manner that ensures they need to be completed.
- Encourages Team Collaboration and Communication: A PERT chart’s clear and coherent structure enhances open communication and collaboration among team members. Everyone can see the broader picture and understand how their work contributes to the project.
Cons of PERT Charts for Project Management
PERT charts are undeniably resourceful for project managers, but they have drawbacks. Here are some considerations to keep in mind:
- Complexity in Large Projects: PERT charts can become irresistibly complex for vast and complex projects. Keeping track of numerous tasks and dependencies might result in a confusing web of information that’s hard to decipher.
- Overemphasis on Time Estimates: PERT charts rely heavily on time estimates, which can be a double-edged sword. Inaccurate estimates can lead to misguided expectations and planning.
- Potential Analysis Paralysis: The detailed analysis that PERT charts demand can sometimes slow decision-making. Managers may be caught up in constant revisions, especially when projects face frequent changes.
- Resource Management is Not a Primary Feature: Unlike other project management tools, PERT charts do not emphasize resource allocation for tasks. This omission can lead to inefficiencies without additional resource management strategies.
- Can Lead to Information Overload: The amount of detail included in a PERT chart might trouble team members. It would be difficult to identify the most crucial tasks at a glance.
- May Not Reflect Current Progress: Once a PERT chart is drawn up, it may not accurately reflect the project’s real-time status unless it is frequently updated, which can be a time-consuming process in itself.
How Do PERT Charts Complement Tools Like Gantt Charts and Kanban Boards?
PERT charts, with their focus on task dependencies and time estimation, complement the visually detailed schedule of a Gantt chart and the flexible, task-oriented approach of a Kanban board.
- A Gantt chart provides a linear representation of a project schedule. It includes start and end dates, which pairs well with the PERT’s analytical technique to pinpoint the critical path.
- Kanban boards, which emphasize workflow and task progression, enjoy the PERT chart’s overview of task sequences and timeframes. It allows a smoother flow management and a more cohesive understanding of a project’s scope and resources.
Completing PERT charts with these tools can result in an inclusive system. The system enhances visibility, predicts possible blocks, and improves project management efficiency.