
35+ Printable Blood Sugar Tracking Log Sheets and Charts (PDF, Excel)
Monitoring blood sugar levels is an important part of staying healthy and managing diabetes. Blood sugar, also known as blood glucose, is the essential fuel for our body and brain to function, and insulin produced by the pancreas typically regulates it. A blood sugar chart, in simple terms, tracks your blood glucose levels over a period of time.
After collecting your blood sample, you can use a variety of methods to check the levels from urine dipsticks to digital pharmacy glucometers that measure and record automatically. The chart will show possible correlations with activities or foods in relation to the resulting fluctuations in your blood sugars so that you can identify the changes and make notes on how you felt during those differences in sugar levels. With this information, you’ll have greater insight into how individuals can modify their lifestyles to maintain healthy sugar levels.
- Accounting Templates
- Art & Media
- Budget Templates
- Business Templates
- Calendar Templates
- Certificates
- Charts
- Education Templates
- Inventory Templates
- Invoice Templates
- Letter Templates
- Medical Templates
- Personal Templates
- Project Plan Templates
- Timesheet Templates
Download Free Blood Sugar Chart Templates
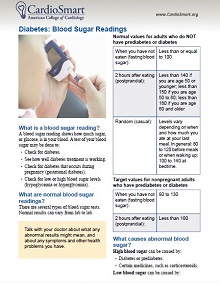
What is a Blood Sugar Chart
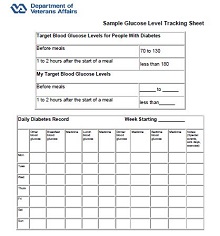
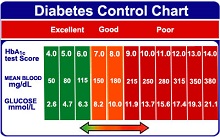
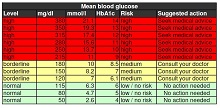
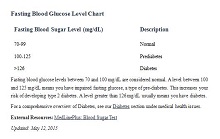
Blood sugar charts are essential tools for managing diabetes. They help to track better, monitor, and manage changes in glucose levels throughout the day. They are typically divided into four sections, each section representing a different range of glucose values. The target range is when glucose readings should be the most stable, while the extreme range is where readings should not drop or surge above this set level, as this can have negative consequences on a person’s health.
A blood sugar chart provides an individual with an overall overview of their current condition, enabling them to adjust medications and insulin dosages accordingly. Optimizing these parameters in line with the chart can help minimize slow and fast changes that could potentially lead to health issues related to diabetes.
Types of Blood Sugar Chart
Monitoring your blood sugar is important if you have diabetes. It can help you keep track of how your diet and activity affect your blood sugar levels, and it can be an important tool in managing your diabetes. There are several types of blood sugar charts, including:
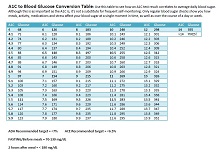
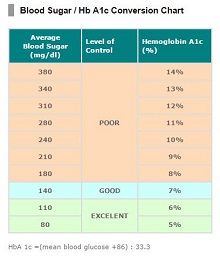
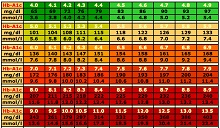
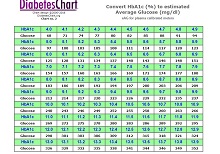
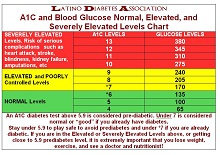
The A1C Chart
The most common chart used to monitor blood sugar levels is the A1C chart. This chart uses the hemoglobin A1C test, which measures the average amount of glucose in your red blood cells over a three-month period. It is usually done once every three months as part of routine diabetes care. Your doctor or healthcare provider will use this chart to determine how well you are controlling your diabetes and make recommendations for lifestyle changes if needed.
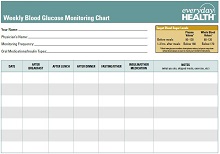
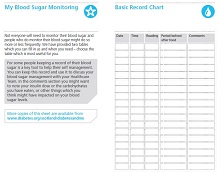
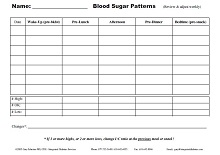
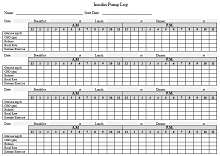
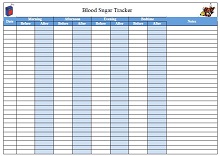
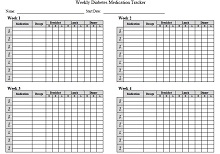
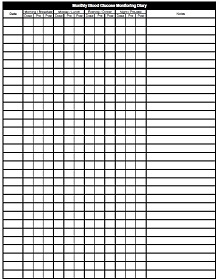
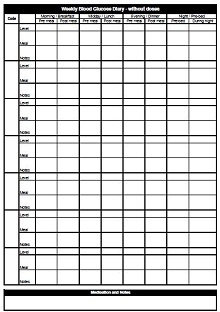
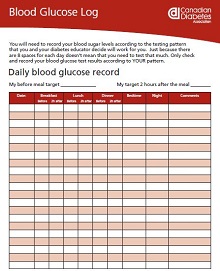
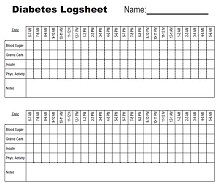
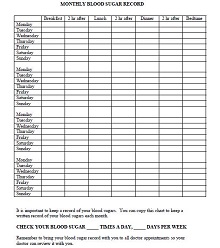
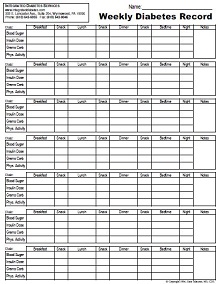
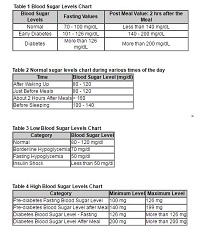
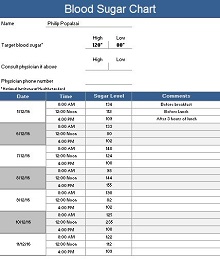
The Glucose Log
Another type of chart used to monitor blood sugar levels is known as the glucose log. This type of chart allows you to record your daily readings from a glucometer or other device that measures your blood sugar levels. The glucose log helps you see how changes in diet or physical activity affect your blood sugar level over time, allowing you to make adjustments accordingly. As with any other type of medical information, be sure to discuss any changes or trends that you notice with your healthcare provider.
Glucose Load Chart
Finally, there is the glucose load chart, which looks at the number of carbohydrates in food and how quickly they are converted into glucose in the body. This type of chart can help you understand which foods raise or lower your blood sugar more quickly and plan meals accordingly when trying to manage diabetes. Keeping track of these readings can also help alert you if any dangerous spikes or drops occur during meals or snacks so that you can adjust as needed before something serious happens.
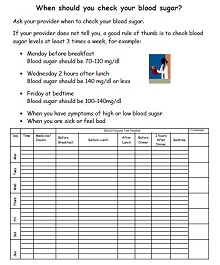
Tips to Maintain Healthy Blood Sugar Levels
Keeping healthy blood sugar levels is key to avoiding illness and managing existing conditions. Eating meals with a balance of proteins and carbohydrates, engaging in regular physical activity, and getting plenty of sleep are all good habits for keeping healthy glucose levels. It’s also important to monitor glucose levels regularly, although the exact schedule depends on whether you’re trying to control existing diabetes, as well as factors such as recent physical activity or changes in diet or medication.
If you find that your glucose levels drop suddenly or too frequently, it could be helpful to use low-sugar snacks like whole fruits, nuts, nut butter, boiled eggs, or cheese sticks throughout the day. Finally, reducing stress can also be beneficial toward maintaining healthy blood sugar levels over time, activities such as deep breathing exercises and yoga can help relax your mind and body in times of stress.

Creating a Blood Sugar Chart Template for Diabetes Management
Managing diabetes can be challenging, but with the right tools, it can be done effectively. One of those tools is a blood sugar chart template. It is an easy-to-use document that helps you track your daily glucose levels and easily spot any concerning trends.
Gather Your Records
The first step in creating a blood sugar chart template is gathering all the records that you need. You should have records from your doctor or pharmacist, as well as any records from your health care provider related to managing diabetes. This information will help you accurately capture your glucose levels over time and provide insight into how changes in diet and lifestyle may affect your glucose readings.
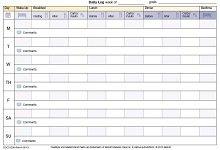
Choose a Format for Your Template
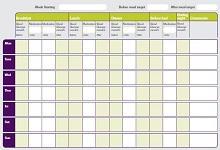
There are several ways to format a blood sugar chart template. For example, some people prefer to use a spreadsheet format while others may opt for a more graphically appealing design. When deciding which format to use, consider how much data you need to capture and how often you plan on updating the chart.
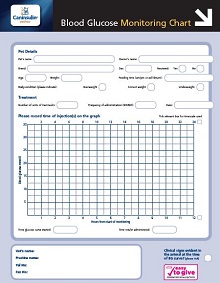
If you’re tracking multiple metrics or want to record readings on specific dates or times, then a spreadsheet may be the best option for you. On the other hand, if all you need is basic readings like average fasting glucose levels or post-meal readings, then something like an illustrated graph might work better for you.
Enter Your Data
Once you have chosen your format, it’s time to enter your data into the template. Start by entering baseline readings, such as fasting glucose levels or post-meal readings, into their respective columns or fields on the template.
Next, enter any additional data that is relevant such as the date of testing, type of test performed, medications taken at the time of the test, etc. Be sure to include notes about any factors that could affect your results, such as illness or stress levels, so that these can be taken into account when analyzing results over time.